Ecommerce Metrics: The Numbers That Run a Store (and Your Interview)

On this page
Look through a few ecommerce job postings and count how often you see "data-driven" or "owns the KPIs" or "reports on performance."
Then look at the interview question that usually goes with it. "Conversion rate dropped 20% overnight. What do you do?"
Most people can define the term. Far fewer can work that problem out loud, and that gap is where a lot of offers get decided. This guide covers the ecommerce metrics a store really runs on, the math for each one, a short report you can build, and how I'd answer that overnight question. I've been teaching people how to get into this kind of work since 2016, and I'd take someone who can reason through a bad number over someone who memorized forty acronyms.
A quick note on the examples: when I use a store's numbers to show the math, I made them up, and I'll say so. Where I quote an industry figure, I link to who published it.
The ecommerce KPIs that actually run a store
The ecommerce KPIs that run a store are revenue, conversion rate, average order value, customer acquisition cost, customer lifetime value, repeat purchase rate, gross margin, return rate and cart abandonment. Together they tell you who's buying, how much you keep and where shoppers leave.
Ecommerce metrics are anything you can measure. A KPI is a metric that somebody has decided the business will steer by. Your platform has hundreds of the first kind. A healthy company has maybe eight or ten of the second.
One equation holds most of this together:
Revenue = traffic × conversion rate × average order value
Revenue only moves when one of those three moves. So when someone says "sales are down," you've already got a place to start: did fewer people come, did fewer of them buy, or did they spend less per order?
Made-up store: 50,000 sessions a month, a 2% conversion rate, and a $70 average order. That's 1,000 orders and $70,000 in revenue. Lift conversion to 2.4% and you've added $14,000 without buying a single extra click. Almost every decision a store makes is an attempt to push on one of those three numbers while not wrecking profit.

Sales metrics: revenue, conversion rate and average order value
Sales metrics show what happened at the register. Track net revenue after discounts and returns, conversion rate as orders divided by sessions, and average order value as revenue divided by orders. Read all three together, since one can improve by hurting another.
Revenue. Be specific about which revenue. Gross sales is the big flattering number before discounts and returns. Net sales is what's left after them. Companies differ on the labels, so ask how yours defines it before you put a number in front of anybody.
Conversion rate = orders ÷ sessions. Some tools count unique visitors instead of sessions, and you'll get a different answer, so note which you're using.
What counts as good? Everyone wants a number here, and the published ones disagree. Shopify's August 2026 roundup cites Statista at 1.4% of global ecommerce visits converting in Q1 2026, and Dynamic Yield at 2.66% across more than 400 brands. Those sources measure different things, and your category, price point and traffic mix all move it. A $900 sofa isn't going to convert like a $14 candle. Treat your own trailing 12 months as the real benchmark.
Average order value = revenue ÷ orders. AOV is where bundles, free-shipping thresholds and "add this too" offers do their work. Be careful with it, because a discount that raises AOV by getting people to buy two can still lose money once you look at margin.
Conversion and AOV can also trade against each other. Run a 30% off sale and conversion usually climbs while AOV and margin fall. Reporting only the metric that improved is a good way to lose your boss's trust.
Customer metrics: CAC, lifetime value and repeat purchase
Customer metrics show whether buying customers is worth it. Customer acquisition cost is marketing spend divided by new customers. Lifetime value estimates what those customers bring in over time. The repeat rate shows how many came back.
Customer acquisition cost = marketing spend ÷ new customers. Made-up month: $12,000 in ads and agency fees, 300 new customers, a $40 acquisition cost. Include what you're actually paying for. Leaving out the agency retainer gives you a lovely number and a false one.
Customer lifetime value has a dozen formulas. A simple one that holds up is:
Lifetime value = AOV × purchases per customer × gross margin
Use profit rather than sales, because you don't get to keep the revenue. At a $70 order, 2.5 orders and a 50% margin, that customer is worth about $87.50 in gross profit, so a $40 CAC looks reasonable. If that same customer only ever orders once at a 30% margin, you're earning $21 on a $40 customer, and growth is just a faster way to go broke.
Repeat purchase rate = customers with two or more orders ÷ total customers. Pick a time window and keep it. A consumable like coffee should see more reorders than a mattress, so compare yourself to your own history before you panic.
Retention is usually the cheapest growth a store has, and the place where email earns its keep. If you're on the marketing side, how email marketing KPIs fit into this picture is worth a read, since good retention reporting has to bring both together. Automating the follow-up is its own craft; my guide to ecommerce automation covers what to set up first.
Profit metrics: gross margin and return rate
Profit metrics show what the store keeps. Gross margin is the share of revenue left after the cost of goods, and return rate is the share of orders sent back. A store can post record revenue and still lose money if either one slips.
Gross margin = (revenue − cost of goods sold) ÷ revenue. Sell a $70 item that cost $28 to make and land, and you're at 60%. Then come shipping, payment processing, packaging, ads and salaries, which is why a thin-margin business has so little room for mistakes. Strong retention helps cover those costs.
Return rate = units returned ÷ units sold. Break it out by product. A store-wide return rate hides the one jacket with a sizing problem that's costing you a fortune, and that jacket is the insight your manager will remember you for.
Returns also distort other numbers. Revenue booked on Black Friday partly comes back in December. If your CAC and lifetime value math ignores returns, it's flattering you.
A lot of beginners skip the profit side of their ecommerce metrics because it looks like finance. I'd do the opposite. Plenty of candidates can talk about traffic. Very few walk into an interview and ask what the contribution margin looks like on the top sellers.
Funnel metrics: cart abandonment and where shoppers leave
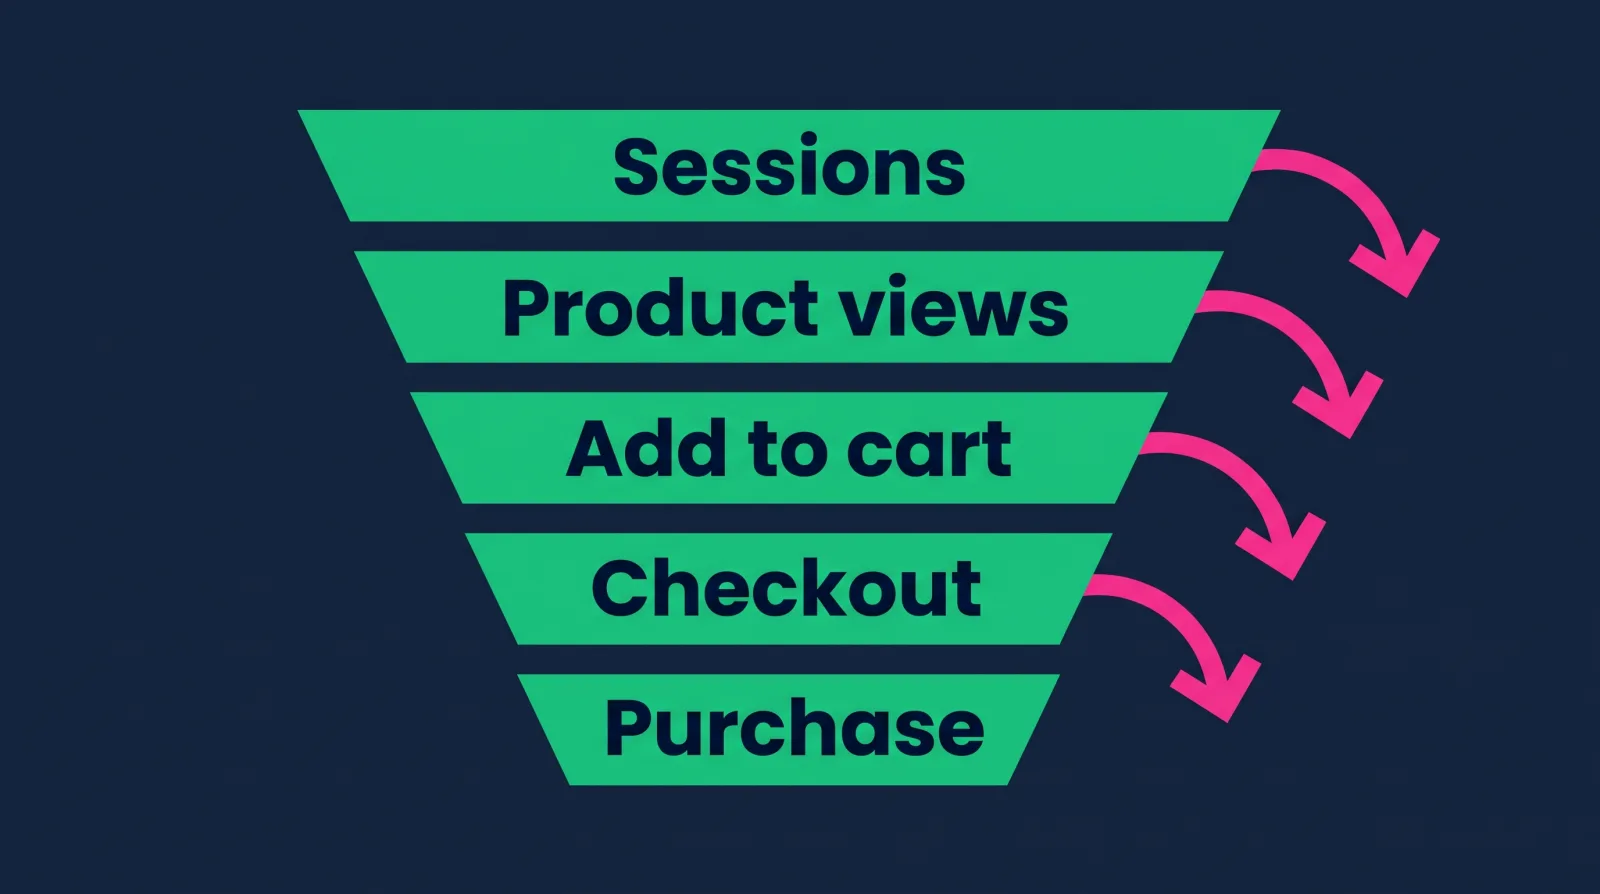
Funnel metrics show where shoppers drop out between landing and paying. Measure each step: product views, add-to-cart rate, checkout starts and completed orders. Cart abandonment is the best known, and the documented average sits around 70%.
Cart abandonment rate = 1 − (completed orders ÷ carts created).
Baymard Institute's average across 50 studies is 70.22%, so roughly seven out of ten carts don't make it, and that's normal. Don't let anyone tell you theirs is a crisis because it's 68%. A lot of those people were never going to buy. Baymard's research on US shoppers found 42% abandoned because they were just browsing.
Take those out, and the reasons get useful. Among the rest, Baymard found 40% left because extra costs like shipping, tax and fees were too high, 20% because delivery was too slow, and 19% because they didn't trust the site with their card.
Each of those is fixable by somebody on the team. Show shipping earlier. Add a delivery estimate on the product page. Add recognizable payment options. This is what ecommerce metrics are for: a number points at a place, and then you go and look at the place.
Lay your funnel out in steps and compare each to the last. If add-to-cart looks fine but checkout starts collapse, your cart page has a problem. If a single step fell on mobile only, you're probably looking at a bug. Follow shoppers through their own journey, too. Buy something from your own store on your phone once a month. You'll be amazed what the dashboard didn't tell you.
A Monday morning report you can build in an hour
A useful Monday report fits on one page: last week's revenue, traffic, conversion rate and average order value against the prior week and last year, plus top products, ad spend, stock problems and one recommendation. It should end with a decision.
| Line | Last week | Prior week | Same week last year |
|---|---|---|---|
| Net revenue | |||
| Sessions (traffic) | |||
| Conversion rate | |||
| AOV | |||
| New vs. returning customer share | |||
| Ad spend and CAC | |||
| Gross margin | |||
| Return rate |
Under the table, write three short notes: what changed, why you think it changed, and what you recommend doing about it. Mark your guesses as guesses. Your manager will trust you more for it.
Compare against the same week last year wherever you can, because comparing to last week falls apart around holidays and promos. A store's traffic in the week after a big sale is going to look terrible against the sale itself, and that tells you nothing.
If the store is on Shopify, start in the admin's reports section, which groups default reports into categories like Acquisition, Behavior, Customers, Sales, Profit, Inventory and Marketing. What's available can vary by plan, so check what yours includes. Then pair it with your ad platforms and Google Analytics, because no single source has the whole picture and the sources will disagree. Pick one as the source of truth for each metric, and write down which.
If you're choosing a platform or wondering how the reporting side differs across them, I compared the two big names in BigCommerce vs Shopify.
Conversion dropped overnight: how to work the problem
When conversion drops overnight, check whether the data is broken first, then split the drop by device, traffic source, browser, country and funnel step. Look for what changed: a deploy, a theme edit, a new app, a promotion or a payment issue. Fix, then confirm.
Is it real? A tracking script that broke, a consent banner change, or a bot traffic spike can all produce a fake conversion drop. Compare the analytics order count to the actual orders in the store admin. If orders are steady and your conversion rate fell, you've got a measurement problem or a traffic problem, and the store itself is fine.
Did traffic quality change? Conversion rate has a denominator. If a TikTok post sent 40,000 curious people to your site overnight, conversion will fall even though every buyer who'd normally buy still did. Check revenue before you panic. Then segment traffic by source.
Where in the funnel? Compare each step with the same day last week. A drop at payment points somewhere very different from a drop at add-to-cart.
Is it only one device or browser? Mobile-only problems are often front-end bugs. Safari-only is even more telling.
What changed? Ask the awkward question out loud. Who pushed a theme update? Did someone install an app? Did a discount code expire, a price change, shipping rates update, a payment provider have an outage, or the best seller go out of stock?
Then you fix the cause, and afterward you watch the number until it comes back. If you're the person who writes down what happened so it can't happen twice, you've done something most stores never do.
Using ecommerce metrics in interviews
Interviewers ask about ecommerce metrics and ecommerce KPIs to see how you think. Name the number, explain what moves it, and describe what you'd check next. Walking through a process earns more trust than reciting definitions, especially when you admit what you don't know yet.
Questions you should be ready for:
- What would you look at first on a Monday morning?
- Revenue is flat but traffic is up 15%. What's going on?
- Would you rather raise conversion or AOV, and why?
- How would you decide if a promotion worked?
I keep a longer list of ecommerce interview questions with how to answer them. On that second one, the honest first answer is "conversion or AOV fell, so I'd check which, then split by channel, because new traffic may simply be colder." Notice that it doesn't need a single piece of jargon.
No store experience? Pick a real brand, walk its funnel on your phone, and write a one-page teardown of where you think it's leaking and what you'd measure to prove it. Or build a small practice store and report on it, labeling any sample numbers clearly as samples. On your résumé, tie every metric to an action. Guidance on writing an ecommerce resume can help, and these ecommerce skills show what else employers expect next to analytics.
If you want a guided route, the Ecommerce Specialist career path takes you step by step from the basics of running a store to the reporting side of the job. Starting with My First Shopify Store gets you a real admin to practice in, and there's a list of the best Shopify courses if you'd like to see how the options compare.
Diamond membership lists at $60 a month or $365 a year, and there's always at least 30% off, so you'd really pay about $42 a month or about $255 a year. That gets you 90+ courses, guided paths for beginners, portfolio templates, an ATS-ready résumé builder, a job board, an 80,000+ member community, and two live weekly calls: Accountability on Wednesdays at 7 PM ET and Money Talk on Sundays at 8 PM ET. There's also a 7-day money-back guarantee. The roles we train people for pay $75k+, individual results vary.

FAQ
What's a good ecommerce conversion rate?
It varies a lot by category, price and traffic source. Recent published averages range from 1.4% (Statista, Q1 2026) to 2.66% (Dynamic Yield), as cited by Shopify. Your own history matters more than either figure, so compare against the same period last year and against each traffic source separately.
What's the difference between ecommerce metrics and KPIs?
Ecommerce metrics are anything a store can measure, from page views to refund counts. KPIs are the few metrics a business has chosen to run on, with a target and an owner attached. Every KPI is a metric, but most metrics never deserve to become a KPI.
Which ecommerce metric matters most?
If I had to keep one, it'd be gross profit after marketing, because a store survives on what it keeps. For a growing store, the relationship between customer lifetime value and customer acquisition cost is the next thing I'd look at. Revenue alone can hide a business that's losing money.
Where do you find ecommerce metrics in Shopify?
Start with the Analytics area of the Shopify admin. Reports there are grouped into categories including Acquisition, Behavior, Customers, Sales, Profit and Inventory, with availability depending on your plan. Compare those numbers against your ad accounts and Google Analytics, and pick one source of truth per metric.
You don't need to be a math person for any of this. If you can divide, you can do the job, and the rest is practice looking at a number and asking what happened.
Start small. Take one store, even a pretend one, and do the Monday report once. When you want people around you who are working toward the same thing, come see the Ecommerce Specialist path. We'd be happy to have you.