Email Marketing KPIs: The Numbers That Prove Email Makes Money

On this page
Go pull up the last email report your platform generated. Look at the first number on it.
There's a good chance it's open rate, and a good chance that number is wrong in a way nobody in the meeting is going to mention. Apple's Mail app downloads remote content in the background by default when a reader turns on Mail Privacy Protection, so the little tracking pixel can fire whether or not a human ever looked at your email.
So a lot of email marketing KPIs are sitting on a number that a phone can generate by itself.
I've been teaching this stuff since 2016, and reporting is the part of the job I think people underrate the most. Anyone can learn to build a flow. The person who can walk into a Monday meeting and say what email brought in last month, and what they're changing because of it, is the one who gets kept, promoted and paid. This post covers the numbers I'd track, the math for each, and the one-page report that holds them together.
Which email metrics belong on a KPI report?
A KPI report should hold six email metrics: revenue per recipient, click-through rate, conversion rate, list growth, unsubscribe rate and spam complaint rate. Bounces sit underneath as a health check. Opens stay off the top line.
A metric is anything you can count. A KPI is a metric somebody has agreed to be judged on. Your platform will happily show you forty email marketing metrics, and most of them are there because they were easy to build a chart for. Good email marketing KPIs are a much shorter list.
I use one test before a number earns a spot: if it can go up while sales go down, it doesn't get the top line.
Send a hype subject line to your whole list and opens might jump while unsubscribes spike and orders stay flat. Revenue per recipient can't play that trick.
One thing before the formulas. Decide on your denominator and keep it. Some platforms calculate rates against emails sent, others against emails delivered, and a report that switches between them month to month is comparing nothing to nothing. I use delivered everywhere below, except for bounce rate, which only makes sense against sent.

Revenue per recipient: the KPI I'd put first
Revenue per recipient tells you how many dollars each delivered email earned. Divide the revenue attributed to a send by the number of people it reached. It works across list sizes, which makes it the fairest way to compare two emails.
The formula:
Revenue per recipient = attributed revenue ÷ emails delivered
Say a campaign reached 20,000 people and your platform attributes $3,400 in orders to it. I made those numbers up to keep the math clean. That's $0.17 per recipient. Next week a smaller segment of 4,000 people brings in $1,200, which is $0.30. The second send earned less in total and did far better work, and a total sales column would have told you the opposite.
Two warnings, because this is where people embarrass themselves.
Attribution windows are generous. Most platforms credit an email if someone clicks or opens and then buys within a set number of days, and that person might have bought anyway. Check what window your tool uses, write it on the report, and don't change it mid-year. If your company has the volume, run a holdout: leave a random slice of the list out of a flow for a month and compare what they spent. That's the closest thing you'll get to proof that email caused the sale.
And if you're in B2B, nobody checks out in your email. Swap dollars for pipeline or booked demos and keep the same per-recipient logic. My B2B email marketing guide gets into how those programs measure success.
ROI is the cousin of this number, and finance will ask for it: (attributed revenue − cost) ÷ cost. Include platform fees and the hours of whoever builds the emails, or the ROI you report will look great right up until someone in finance redoes it.
Click-through rate and conversion rate tell you where it broke
Click-through rate measures how many delivered emails earned a click, and conversion rate measures how many ended in the action you wanted. Read together, they show whether the problem sits in the email or on the page after it.
Click-through rate = unique clicks ÷ emails delivered
Conversion rate = orders (or signups) ÷ emails delivered
Plenty of tools calculate this one against clicks instead, which is one reason two sets of email marketing metrics rarely match. That's a useful number too, because it isolates the landing page, but label which one you're showing.
Clicks are the most honest engagement signal you've still got. A click takes a thumb and some intent. (Bots and security scanners do click links sometimes, so a strange spike in the first minute after sending deserves a second look.)
The way I read the pair:
| What you see | What it usually means | Where to look |
|---|---|---|
| Low clicks, healthy conversion | The people who click want it, but too few are clicking | Offer, call to action, segment |
| High clicks, low conversion | The email made a promise the page didn't keep | Landing page, price surprise, broken link |
| Both low | Wrong audience or wrong moment | Targeting and timing |
| Both high | Something worked | Write down what, then repeat it on purpose |
For a reference point, Mailchimp's benchmark page lists an average click rate of 2.62% across all users and 1.74% for ecommerce. That data was last updated in December 2023 and mixes every kind of sender, so treat it as a rough sanity check. Your own trailing six months will tell you more than anybody else's average.
Flows and campaigns also behave very differently here. A triggered email sent to someone who just left a product in their cart is going to beat a Tuesday newsletter on every measure, so report them on separate lines. If you want to see what strong triggered emails look like, I broke some down in these abandoned cart email examples.
Open rate, and why it lies now
Open rate is opens divided by emails delivered, and since Apple's Mail Privacy Protection it overstates how many people read your email. Use it only to spot sudden drops and compare subject lines among non-Apple readers, never as proof of success.
People like to say opens are dead. I'd call it a demotion.
The mechanism matters, because an interviewer may ask. With Protect Mail Activity turned on, Apple routes remote content through relays and fetches it in the background, which registers as an open. Your pixel can't tell the difference between a person and that background fetch. Mailchimp's all-users average of 35.63% in that same table is a number to read with one eyebrow up.
The number still has two jobs.
The first is as a smoke alarm. If the number has hovered around the same level for months and falls hard in one week, something happened at the inbox level, and the cause is probably deliverability. You didn't suddenly get worse at subject lines overnight.
The second is subject line testing, if your platform lets you exclude Apple's machine opens or you test on clicks instead. I'd test on clicks. It's less work and you don't need to explain any of this to your boss.
What you shouldn't do is trigger automations from opens. A "didn't open, send it again" flow will skip people who never saw the first one, and a "engaged in 90 days" segment built on opens will keep paying to mail people who left a long time ago. Build engagement segments on clicks and purchases.
Bounce, unsubscribe and complaint rate protect the list
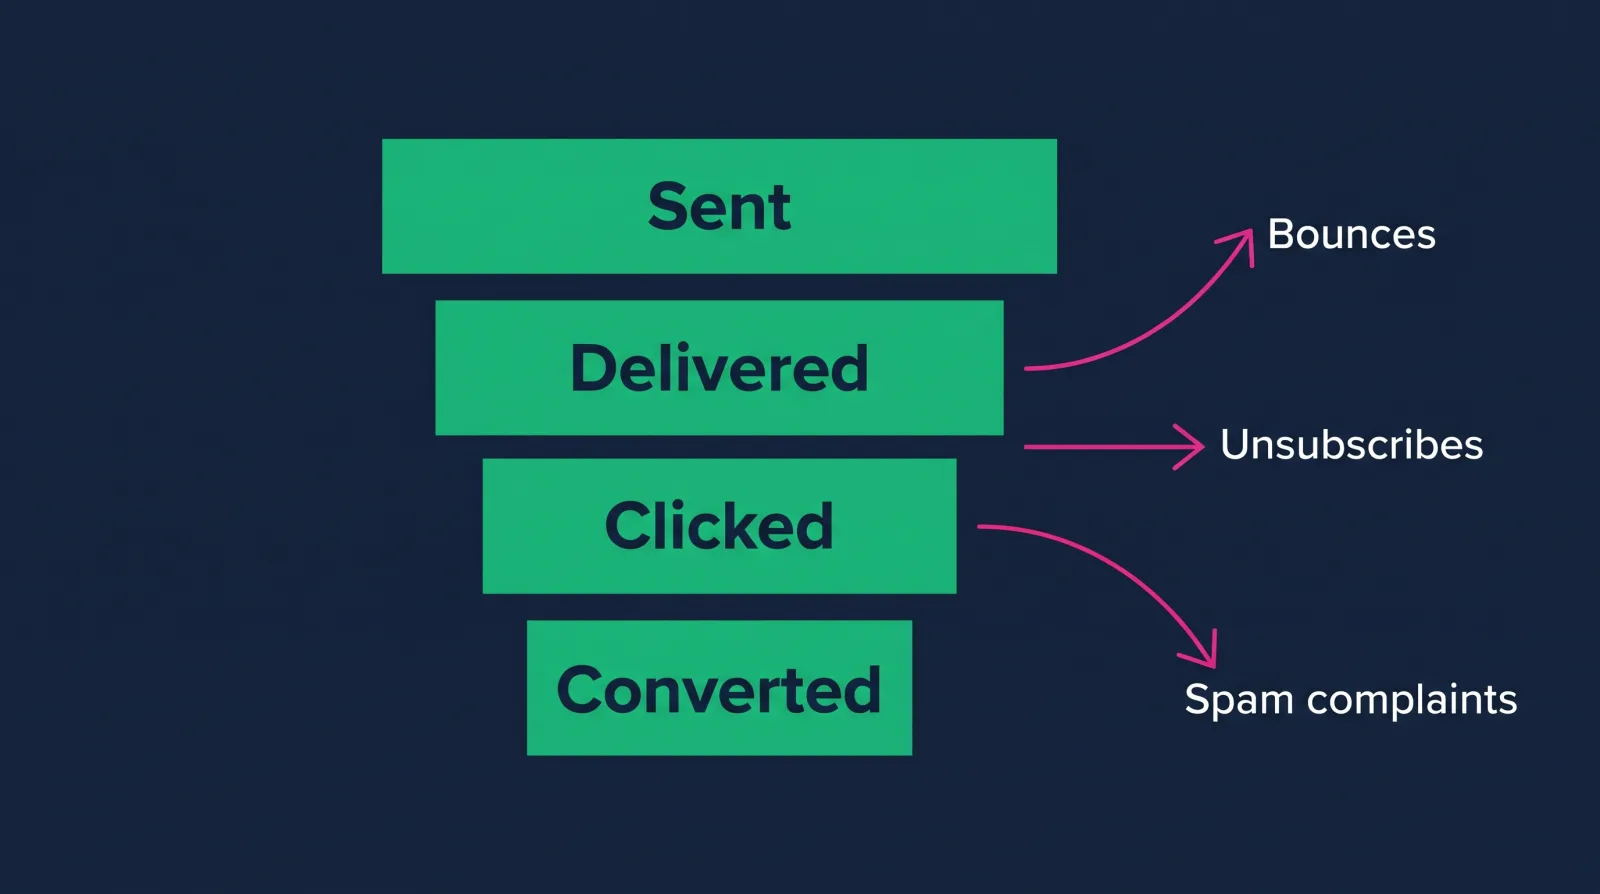
These three numbers measure list damage. Bounce rate shows bad addresses, unsubscribe rate shows people leaving politely, and complaint rate shows people leaving angry. Complaints do the most harm, because Gmail publishes a line you shouldn't cross.
Bounce rate = bounced emails ÷ emails sent. Hard bounces are permanent failures, and those addresses should be suppressed automatically. Soft bounces are temporary. I don't have a sourced universal cutoff for you, so watch your own baseline and investigate spikes. A sudden jump usually means a bad import or a purchased list that somebody swore wasn't purchased.
Unsubscribe rate = unsubscribes ÷ emails delivered. Mailchimp's table puts the average at 0.22% across users. Unsubscribes aren't a tragedy. Somebody who doesn't want your emails leaving through the front door is much better than the alternative.
Complaint rate = spam reports ÷ emails delivered. This is the alternative. Google's sender guidelines tell senders to keep the spam rate in Postmaster Tools below 0.3%, recommend staying under 0.10%, and require one-click unsubscribe for marketing mail from anyone sending more than 5,000 messages a day to Gmail accounts.
Yes, 0.3% sounds tiny. That's three complaints per thousand.
Set up Postmaster Tools, because your email platform's complaint number doesn't always capture Gmail. If you only have room for one inbox-health line, make it this one.
List growth and list quality
List growth rate measures how fast your audience grows after losses are subtracted. A growing list that buys less each month is getting worse, so pair the growth number with revenue per subscriber before you celebrate it.
List growth rate = (new subscribers − unsubscribes − bounces − complaints) ÷ list size at the start of the period
Most dashboards show gross signups, which is the flattering version. Net is the version that tells you if you're filling a bucket with a hole in it.
Then look at where those people came from. A giveaway can add thousands of people who wanted the prize and will never buy anything from you. Break new subscribers out by source (popup, checkout, lead magnet, webinar) and after 90 days check which sources produced buyers. That one breakdown has more strategy in it than most quarterly decks.
You're also paying for those people. Many platforms price by list size, so a bloated list costs real money every month while dragging your engagement down. Sunsetting people who haven't clicked or bought in six months or so usually pays for itself. Growth and quality pull against each other a little, and it's your job to say that out loud in the report.
How to build the one-page email report
A one-page email report states what email earned, which sends drove it, what went wrong and what you'll do next. Keep it to one screen, compare against last month and the same month last year, and finish with decisions.
Fill this layout once by hand before you try automating anything, because you'll learn where your data disagrees with itself.
| Section | What goes in it |
|---|---|
| Headline | One sentence: what email brought in and how that compares to last month |
| Money | Attributed revenue, revenue per recipient, share of total store sales |
| Flows vs. campaigns | Same numbers, split into two lines |
| Engagement | Click-through rate, conversion rate |
| Audience | Net list growth, unsubscribe rate |
| Health | Spam complaints from Postmaster Tools, bounces |
| Best and worst send | One each, with one sentence on why |
| Next month | Two or three things you'll change |
That last row is the one that gets you noticed. A report that ends in numbers makes your manager do the thinking. A report that ends in "we're moving the second cart reminder from 24 hours to 12 and testing it against the current version" makes you look like you're running the program, because you are.
Write the headline like a person: "Email brought in $41,200 in October, up 8% from September, and most of the gain came from the rebuilt welcome flow." I made that one up, but notice that the sentence would survive being forwarded to the CEO with no context at all. If you're trying to connect this reporting to actual sales conversations, how to use email marketing for sales is a good companion read.
Using email marketing KPIs to get hired and paid
Hiring managers want proof you connect email to money. Put email marketing KPIs in portfolio write-ups and résumé bullets, name the formula you used, and be ready to explain why open rate isn't your main number. That answer alone separates you from most applicants.
If you've never had a real list to report on, you can still practice. Build a sample store's flows, write a mock monthly report from invented data that you openly label as sample data, and walk through what you'd change. Honesty about that matters. A clearly labeled practice report shows you know how the work is done, and a fake result gets you caught in the first follow-up question.
In interviews, expect some version of "how do you measure whether email is working?" A strong answer names revenue per recipient, explains the attribution window, mentions why open rate got demoted, and ends with something you'd do about a bad number. That takes about a minute to say and takes a while to actually understand. My list of email marketing skills employers hire for shows where reporting fits next to deliverability, copy and automation.
This is the kind of work the Email Marketing Specialist career path is built around. It's a guided route for beginners, so you aren't guessing what to learn next, and Email Marketing for Developers is one of the courses you can start with. Diamond membership lists at $60 a month or $365 a year, and there's always at least 30% off, so you'd really pay about $42 a month or about $255 a year. For that you get 90+ courses, portfolio templates for every path, an ATS-ready résumé builder, a job board, an 80,000+ member community, and two live calls every week: Accountability on Wednesdays at 7 PM ET and Money Talk on Sundays at 8 PM ET. There's a 7-day money-back guarantee too. The roles this path points to pay $75k+, individual results vary.

FAQ
What's a good click rate among email marketing KPIs?
It depends on your industry, your list and the kind of send, so be careful with any single number. Mailchimp's December 2023 benchmarks show 2.62% across all users and 1.74% for ecommerce. Compare yourself to your own last six months first, and expect triggered flows to run well above campaigns.
Are open rates still useful?
For spotting sudden deliverability problems, yes. As proof that people read your email, no, because Apple's Mail Privacy Protection can register opens with no reader involved. Keep open rate in the health section of your report and judge your sends on clicks and revenue.
Which KPI matters most for ecommerce email?
Revenue per recipient, split between flows and campaigns. It accounts for list size, it ties directly to sales, and it's hard to fake with a clever subject line. I'd pair it with spam complaint rate, so nobody hits a revenue goal by hammering the list until Gmail stops delivering.
How often should you report on email marketing KPIs?
Monthly works for most teams, with a quick weekly glance at complaints and bounces so a deliverability issue doesn't sit for three weeks. Daily reporting mostly produces anxiety. Compare to the same month last year if your business is seasonal, since November against October tells you very little in retail.
If this felt like a lot, that's fine. Nobody learns this by reading one article about it. You learn it by building a report, getting a number wrong, and working out why.
You don't need to do that alone, either. The people on our weekly calls are working through the same questions while holding down a job and paying the same bills you are. Come take a look at the Email Marketing Specialist path and see if it fits. I'd love to help you get there.